
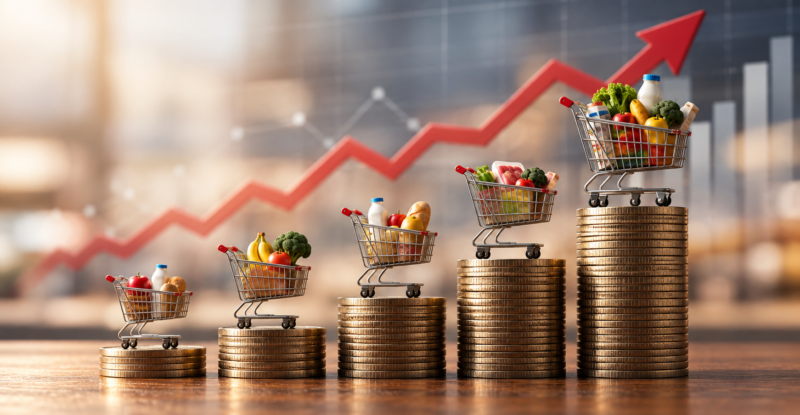
What Is Inflation? Causes, Measurement and Economic Effects
Learn how inflation is measured, why CPI and PCE can differ, what causes prices to rise, and how inflation affects money, savings and the economy.
Inflation is a sustained increase in the overall price level of goods and services across an economy. When inflation occurs, each unit of money generally buys less than before. Economists measure inflation with price indexes such as the Consumer Price Index and Personal Consumption Expenditures price index rather than by looking at the price of one product.
A higher price for gasoline, rent or food does not by itself prove that the entire economy is experiencing broad inflation. The key question is whether prices are rising across a sufficiently wide range of goods and services.
Inflation also describes the rate of change in prices, not simply whether prices are high. Prices can remain elevated even after the inflation rate falls substantially.
What Is Inflation?
Inflation means that the general level of prices is increasing over time.
As prices rise, the purchasing power of money declines unless income rises by a comparable amount.
Suppose a household regularly purchases a basket of goods and services costing $1,000 per month.
If the same basket costs $1,050 one year later, the price level increased by approximately 5%.
The household now needs $50 more to purchase the same collection of goods and services.
This simple example illustrates inflation’s basic effect:
the same amount of money purchases less than it did before.
Inflation Is Not the Same as High Prices
This distinction is essential.
Imagine a price index rises:
- from 100 to 110 in Year 1;
- from 110 to 113.3 in Year 2.
Inflation was approximately 10% during the first year and only about 3% during the second.
Prices did not return to 100.
They continued rising, but at a much slower rate.
This is why households can correctly observe that prices remain much higher than several years ago even while economists report that inflation has fallen.
How Is Inflation Calculated?
A basic inflation calculation compares the value of a price index between two periods.
The simplified formula is:
Inflation Rate = ((Current Index − Previous Index) ÷ Previous Index) × 100
Suppose a consumer price index rises from 250 to 260.
The calculation is:
((260 − 250) ÷ 250) × 100 = 4%
That means the measured price level increased by 4% between the two comparison periods.
What Is the Consumer Price Index?
The Consumer Price Index, or CPI, measures average changes over time in prices paid by urban consumers for a representative basket of goods and services.
The basket includes categories such as:
- housing;
- food;
- transportation;
- medical care;
- recreation;
- education;
- apparel;
- other consumer goods and services.
Each category receives a weight based on consumer spending patterns.
A category representing a large share of household expenditures therefore has a greater effect on the overall index than a category representing very little spending.
How Does the CPI Basket Work?
CPI should not be imagined as a literal shopping cart containing one fixed item from every store.
The Bureau of Labor Statistics collects prices from a large statistical sample and combines those observations using expenditure weights.
The CPI methodology divides consumer spending into hundreds of item categories and geographic areas.
Price changes within those categories are weighted according to their importance in consumer expenditures.
For example, a 20% increase in the price of an item that represents almost none of the average household budget will have less influence on the overall CPI than a smaller increase in a major expenditure category.
Why Your Personal Inflation Rate Can Differ From CPI
CPI measures an average experience across a large population.
No individual household spends money exactly according to the average basket.
Consider two households.
| Household | Major Expenses | Possible Inflation Experience |
|---|---|---|
| A | Rent, public transport, groceries | Highly sensitive to rent and food inflation |
| B | Owned home, vehicle fuel, medical care | More sensitive to energy and health costs |
If rents rise rapidly while gasoline prices fall, Household A may feel much more inflation pressure than Household B.
Geographic location also matters because housing, utilities and services can change differently across regions.
Published inflation therefore measures a broad statistical average rather than every household’s exact cost-of-living experience.
What Is the PCE Price Index?
The Personal Consumption Expenditures price index, or PCE price index, is another major measure of U.S. consumer inflation.
It tracks prices of goods and services purchased by people in the United States or purchased on their behalf.
PCE is produced as part of the national economic accounts and covers a broad range of consumer expenditures.
The Federal Reserve uses the PCE price index when stating its longer-run 2% inflation objective.
CPI vs PCE Inflation
CPI and PCE both measure consumer price changes, but they are constructed differently.
| Feature | CPI | PCE Price Index |
|---|---|---|
| Producer | Bureau of Labor Statistics | Bureau of Economic Analysis |
| Main perspective | Out-of-pocket consumer price experience | Broader consumer expenditure framework |
| Weights | Based primarily on consumer expenditure patterns | Uses expenditure data from business and other sources |
| Substitution | Weights adjust periodically; chained CPI responds more directly | Weights adapt more continuously to spending changes |
| Federal Reserve target | No | Yes |
The indexes can therefore report somewhat different inflation rates even though both are measuring consumer prices.
Neither difference means that one calculation must be incorrect.
The measures answer related questions using different concepts and data sources.
Headline Inflation vs Core Inflation
Headline inflation includes the complete set of prices covered by an index.
Core inflation commonly excludes food and energy.
The exclusion can sound strange because households clearly spend money on both categories.
The purpose is not to claim that food and energy do not matter.
Instead, these prices can be unusually volatile because they respond quickly to factors such as:
- weather;
- commodity markets;
- geopolitical events;
- harvest conditions;
- energy disruptions.
Removing those categories can help analysts study whether underlying price pressure is becoming more persistent across the economy.
Core Inflation Does Not Mean Food and Energy Are Unimportant
This misconception appears frequently when inflation is high.
Households care greatly about food and fuel because both affect real budgets.
Core measures serve a different analytical purpose.
Suppose oil prices jump sharply for one month because of a temporary disruption and then return to their earlier level.
Headline inflation can move substantially even when most other prices change little.
Core measures can help economists determine whether inflation pressure is spreading beyond that temporary event.
For a household budget, however, the actual energy bill still matters.
What Causes Inflation?
Inflation can emerge from several mechanisms, and real-world episodes often involve more than one at the same time.
Demand-Pull Inflation
Demand-pull inflation can occur when aggregate spending grows faster than the economy’s ability to produce goods and services.
Consumers and businesses compete for a limited amount of available output.
Companies may respond to unusually strong demand by increasing prices.
A simplified sequence can look like this:
- Household or business demand rises.
- Available productive capacity becomes constrained.
- Labor and materials become more difficult to obtain.
- Costs and selling prices rise.
- Broader inflation pressure develops.
Cost-Push Inflation
Prices can also rise when the cost of producing goods and services increases.
Possible sources include:
- energy prices;
- raw materials;
- shipping costs;
- wages;
- taxes;
- supply disruptions.
Businesses can absorb some additional costs through lower profit margins.
When the increase is large or persistent, companies may raise prices charged to customers.
Supply Shocks
A negative supply shock reduces the availability of important goods or productive capacity.
An oil disruption provides a classic example.
Higher energy costs can directly increase household expenses while also raising transportation and production costs for businesses throughout the economy.
This type of inflation is difficult because the economy can face weaker output and higher prices simultaneously.
Wages and Labor Costs
Labor costs are a major expense for many service businesses.
Rapid wage growth can contribute to price pressure when productivity does not rise enough to offset the additional cost.
The relationship also works in the other direction.
Workers may demand higher wages after living costs rise.
The important issue is whether wages and prices begin reinforcing each other persistently rather than whether one pay increase occurs.
Inflation Expectations
Expectations can influence present economic behavior.
If businesses become convinced that costs will keep increasing rapidly, they may raise prices sooner.
Workers expecting persistent inflation may negotiate for larger wage increases.
Consumers might accelerate purchases because they expect products to become more expensive later.
When expectations become embedded in behavior, inflation can become harder to reduce.
Does Printing Money Cause Inflation?
The statement that “printing money causes inflation” contains an important idea but is too simple to describe every inflation episode.
A large expansion in money and credit can contribute to inflation when it supports spending that grows faster than real productive capacity.
However, the relationship depends on:
- how much additional money is actually spent;
- how quickly money circulates;
- whether the economy has unused productive capacity;
- bank lending behavior;
- expectations;
- supply conditions.
An increase in central-bank reserves does not mechanically create an identical percentage increase in consumer prices.
The transmission from money and credit to spending and inflation operates through the broader financial and economic system.
What Is the Difference Between Inflation and the Price Level?
The price level describes how expensive goods and services are at a point in time.
Inflation describes how quickly that level is changing.
Consider this simplified example:
| Year | Price Index | Annual Inflation |
|---|---|---|
| 1 | 100 | — |
| 2 | 108 | 8% |
| 3 | 111.24 | 3% |
Inflation fell from 8% to 3%.
The price index nevertheless increased from 108 to more than 111.
This distinction explains why lower inflation does not normally mean that previous price increases are reversed.
What Is Disinflation?
Disinflation occurs when prices continue rising but the rate of increase becomes slower.
For example:
- Year 1 inflation: 8%;
- Year 2 inflation: 5%;
- Year 3 inflation: 3%.
Inflation is declining, but the overall price level is still increasing each year.
Most successful efforts to bring high inflation under control aim for disinflation rather than a broad decline in prices.
What Is Deflation?
Deflation is a sustained decrease in the general price level.
A single product becoming cheaper is not economy-wide deflation.
Broad deflation can be economically dangerous when consumers and businesses expect prices and incomes to continue falling.
Potential consequences include:
- delayed spending;
- weaker corporate revenue;
- pressure on wages;
- increasing real debt burdens;
- lower investment.
Debt becomes particularly important because the number of dollars owed does not automatically decline when the general price level falls.
Inflation vs Disinflation vs Deflation
| Condition | What Prices Are Doing | Example |
|---|---|---|
| Inflation | General price level rising | Prices rise 5% |
| Disinflation | Prices still rising, but more slowly | Inflation falls from 5% to 2% |
| Deflation | General price level falling | Prices decline 2% |
What Are Base Effects?
Year-over-year inflation compares today’s price index with the level one year earlier.
That comparison base can materially change the reported inflation rate even when recent monthly price movements are similar.
Suppose an index moves:
- from 100 to 110 during the first year;
- from 110 to 112 during the next year.
The first annual increase is 10%.
The second is only about 1.8%.
Part of the apparent slowdown reflects the much higher starting point.
This is known as a base effect.
Economists therefore often compare several horizons rather than looking at one year-over-year number alone.
Monthly vs Annual Inflation
An annual inflation rate and a one-month change answer different questions.
Year-over-year data show how much the price level has changed across twelve months.
Monthly data can provide more recent information about whether current price pressure is strengthening or weakening.
However, one month can be noisy.
Analysts often examine:
- one-month changes;
- three-month annualized rates;
- six-month annualized rates;
- twelve-month changes.
Looking across several horizons can help distinguish a persistent trend from a temporary monthly fluctuation.
Why Housing Matters So Much for Inflation
Housing represents a large share of household expenditures and therefore receives substantial weight in consumer inflation measures.
Rent is comparatively straightforward for renters because actual rental payments can be observed.
Owner-occupied housing requires a different approach.
The CPI does not treat the purchase price of a home in the same way it treats the price of a consumer product.
Instead, owner-occupied housing is largely represented through an estimate of the rental value of the housing service the homeowner receives.
This approach helps distinguish the consumption of housing services from the investment value of the physical property.
What Is Owners’ Equivalent Rent?
Owners’ equivalent rent, commonly abbreviated OER, estimates how much a homeowner would pay to rent a comparable home rather than attempting to use changes in house prices directly.
That distinction matters because a home is both:
- a source of housing services;
- an asset that can appreciate or decline in market value.
Consumer inflation indexes aim to measure the cost of consuming housing services rather than fluctuations in the investment price of the asset itself.
As a result, rapid changes in market home prices and measured shelter inflation do not necessarily occur at the same time.
Why Shelter Inflation Can Respond Slowly
Rents usually do not reset every day.
Tenants sign leases, often for many months at a time.
Only a portion of the rental market receives a new price in any particular month.
Changes in newly signed market rents can therefore take time to move through broad inflation measures.
This lag can make shelter inflation remain elevated even after newer market indicators have started cooling.
How Quality Changes Affect Inflation Measurement
Products do not remain identical forever.
A new smartphone may cost more than the previous model while also offering a faster processor, better camera and greater storage.
Simply recording the entire price difference as inflation would ignore the change in product quality.
Statistical agencies therefore make quality adjustments when appropriate.
The objective is to estimate how much of the price difference reflects a genuine change in the cost of obtaining a comparable product and how much reflects improved characteristics.
This process is one reason inflation measurement is more complicated than comparing shelf prices across years.
Substitution and Consumer Behavior
Consumers can adjust purchases when relative prices change.
If beef becomes much more expensive while chicken prices remain stable, some households may buy less beef and more chicken.
Different inflation indexes account for these behavioral changes in different ways.
The chained CPI is specifically designed to incorporate substitution across item categories more rapidly.
PCE weighting also responds more flexibly to changing expenditure patterns than a fixed-basket interpretation might suggest.
Substitution does not mean households are unaffected by higher prices.
It means actual purchasing behavior can change when relative prices change.
Inflation and Purchasing Power
Purchasing power describes how much a unit of money can buy.
Inflation reduces purchasing power when income does not rise equally fast.
Suppose an employee’s salary increases from $50,000 to $52,000.
The nominal pay increase is 4%.
If consumer prices rise 6% over the same period, the employee’s real purchasing power has declined despite receiving a higher dollar salary.
A simplified approximation is:
Real Income Growth ≈ Nominal Income Growth − Inflation
Using the example:
4% − 6% ≈ −2%
The employee earns more dollars but can purchase less with those dollars on average.
Who Is Hurt by Inflation?
The effect depends on income, assets, debts and spending patterns.
Potentially vulnerable groups can include:
- households whose income rises more slowly than prices;
- people holding large amounts of low-yield cash;
- retirees with income that adjusts slowly;
- businesses unable to pass higher costs to customers;
- lenders receiving fixed nominal payments.
Inflation does not affect every household or business equally.
Can Borrowers Benefit From Inflation?
Unexpected inflation can reduce the real burden of fixed-rate nominal debt.
Suppose a borrower owes a fixed $200,000 mortgage.
If wages and the general price level rise significantly while the nominal debt balance remains fixed, that debt can become smaller relative to the borrower’s income and overall prices.
The effect is less favorable when the loan has a variable interest rate because borrowing costs can rise with monetary conditions.
Inflation also does not automatically help a borrower whose income fails to keep pace with living expenses.
How Inflation Affects Savings
Cash savings can lose purchasing power when their after-tax return is below inflation.
If a savings account earns 2% while inflation is 5%, the nominal account balance increases but its purchasing power declines.
The approximate real return is:
2% − 5% = −3%
This does not mean cash has no useful role.
Liquidity, emergency reserves and short-term spending needs can justify holding cash even when its real return is negative.
How Inflation Affects Bonds
Inflation can be particularly important for fixed-income securities because many bonds promise fixed nominal payments.
If expected inflation rises, investors may demand higher yields to compensate for reduced purchasing power.
Higher market yields generally reduce the prices of existing fixed-rate bonds.
The effect tends to be larger for longer-duration bonds because more of their cash flows occur farther in the future.
How Inflation Affects Stocks
The relationship between inflation and stock prices is not simple.
Companies can sometimes pass higher input costs to customers through higher prices.
Other businesses lack sufficient pricing power and experience shrinking profit margins.
High inflation can also lead to higher interest rates, raising financing costs and discount rates used to value future corporate cash flows.
Different industries can therefore respond very differently to the same inflation environment.
How Inflation Affects GDP
Higher prices can make nominal economic output rise even when the quantity of goods and services changes very little.
This is why economists distinguish nominal output from real GDP.
Real GDP attempts to remove the effect of price changes so that analysts can evaluate whether the economy actually produced more output.
High inflation can also influence real activity through purchasing power, interest rates, business costs and uncertainty.
Inflation and Interest Rates
Central banks can respond to persistent inflation by making financial conditions more restrictive.
Higher policy rates tend to increase borrowing costs and reduce some forms of spending and investment.
Slower demand can eventually reduce pressure on prices.
Our guide to monetary policy explains how policy rates are transmitted through credit markets, financial conditions and the broader economy.
Why Higher Interest Rates Do Not Fix Inflation Immediately
Monetary policy operates through a long economic chain.
A rate increase can affect:
- bond yields;
- mortgage rates;
- business financing;
- credit availability;
- asset prices;
- consumer spending;
- business investment;
- employment.
Only after those effects spread through economic activity do they influence broader price and wage behavior.
Inflation can therefore remain elevated for some time after a central bank begins tightening policy.
Can Fighting Inflation Cause a Recession?
Restrictive monetary policy is intended to slow demand enough to reduce price pressure.
The difficulty is determining how much restraint is necessary.
If demand slows only moderately while inflation falls, the economy may avoid a severe downturn.
If financial conditions become too restrictive, spending, investment and employment can weaken enough to contribute to a recession.
The possibility of policy acting with a lag makes this balance especially difficult.
What Is Stagflation?
Stagflation describes an unusually difficult combination of weak economic growth and high inflation.
Ordinarily, weak demand tends to reduce price pressure.
A negative supply shock can produce the opposite combination.
Imagine energy supply becomes severely constrained.
Production costs rise, pushing prices upward, while households lose purchasing power and businesses reduce output.
The economy can then experience both weak growth and elevated inflation.
This environment creates a policy dilemma because measures intended to reduce inflation can further weaken economic activity.
What Is Hyperinflation?
Hyperinflation describes an extreme and rapidly accelerating loss of monetary purchasing power.
It is fundamentally different from ordinary inflation rates experienced by most developed economies.
During hyperinflation:
- prices can change extremely rapidly;
- money loses usefulness as a store of value;
- households try to spend currency quickly;
- contracts become difficult to price;
- normal economic planning becomes severely disrupted.
Hyperinflation is usually associated with extraordinary monetary, fiscal and institutional breakdown rather than routine fluctuations around normal inflation targets.
Can Prices Fall After Inflation Falls?
Individual prices can certainly fall.
Gasoline, food products, electronics and other categories regularly move both up and down.
However, bringing the overall inflation rate from 8% to 2% does not normally imply reversing the earlier increase in the aggregate price level.
At 2% inflation, the general level of prices is still increasing—just much more slowly.
A broad reversal would require deflation.
Why the Federal Reserve Targets Positive Inflation
The Federal Reserve’s longer-run objective is 2% PCE inflation rather than zero inflation.
A low positive inflation rate provides some distance from outright deflation and gives nominal interest rates more room to decline during economic downturns.
Stable positive inflation can also make some adjustments in relative wages and prices easier without requiring widespread nominal price cuts.
The objective is not high inflation.
It is a relatively low, predictable rate that businesses and households can incorporate into long-term decisions.
A Practical Inflation Example
Consider a household with the following simplified annual budget:
| Category | Year 1 Spending | Price Change |
|---|---|---|
| Housing | $18,000 | +5% |
| Food | $8,000 | +6% |
| Transportation | $6,000 | -2% |
| Medical care | $4,000 | +3% |
| Other spending | $4,000 | +4% |
The household does not experience a simple arithmetic average of 5%, 6%, -2%, 3% and 4%.
Housing matters much more because it represents a much larger portion of the budget.
A proper inflation calculation must therefore weight each category according to its share of spending.
This same principle is fundamental to official consumer price indexes.
Why Inflation Measurement Is More Complicated Than Comparing Prices
A useful inflation index needs to address several practical problems simultaneously.
Statistical agencies must account for:
- different household spending weights;
- new products;
- products disappearing from stores;
- changes in product quality;
- consumers substituting between categories;
- changing shopping locations;
- seasonal patterns;
- housing services;
- geographic differences.
For this reason, official inflation statistics use sampling, expenditure surveys and formal index-number methods rather than simply tracking a few familiar prices.
Common Inflation Misconceptions
Lower Inflation Means Prices Are Falling
No. Lower positive inflation means prices are rising more slowly.
Broad price declines are deflation.
One Expensive Product Proves Inflation Is High
A large increase in one category can hurt consumers without representing a broad rise in the overall price level.
CPI Represents Every Household Exactly
CPI is an average based on representative expenditure patterns.
An individual household’s spending mix can differ substantially.
Core Inflation Pretends Food and Energy Do Not Matter
Core measures exclude volatile categories to study underlying inflation trends, not because those expenses are irrelevant to households.
Home Prices Are Inserted Directly Into CPI
Consumer price measurement primarily captures the housing service provided by owner-occupied homes rather than simply tracking resale prices of houses as consumer goods.
All Inflation Comes From One Cause
Demand, supply, wages, expectations, energy, financial conditions and policy can interact in different combinations.
Higher Interest Rates Immediately Reduce Prices
Monetary-policy effects take time to move through borrowing, spending, employment and pricing decisions.
A 2% Inflation Target Means Every Price Should Rise 2%
The target applies to a broad price index over time. Individual prices can rise, fall or remain unchanged by very different amounts.
How to Read an Inflation Report More Carefully
The headline annual rate is only the starting point.
A more complete review asks:
- Is the measure CPI or PCE?
- Is the figure headline or core?
- What happened during the latest month?
- What does the three- or six-month trend show?
- Which categories contributed most?
- Is shelter inflation accelerating or slowing?
- Are goods and services behaving differently?
- Could base effects be affecting the annual comparison?
- Are wage and income gains keeping pace with prices?
- Are inflation expectations remaining stable?
Two reports with the same headline rate can describe very different underlying inflation dynamics.
Frequently Asked Questions
What is inflation in simple terms?
Inflation is a broad increase in the general price level of goods and services over time. As the price level rises, each unit of money normally purchases fewer goods and services unless income increases by a similar or greater amount.
How is inflation measured?
Inflation is measured by tracking changes in price indexes between periods. In the United States, major measures include the Consumer Price Index produced by the Bureau of Labor Statistics and the Personal Consumption Expenditures price index produced by the Bureau of Economic Analysis.
What causes inflation?
Inflation can result from strong demand, limited productive capacity, rising business costs, supply disruptions, wage pressure and changing expectations. Major inflation episodes often involve several of these forces operating at the same time.
What is the difference between CPI and PCE?
CPI and PCE both measure consumer price changes but use different coverage, expenditure data and weighting methods. The Federal Reserve states its 2% longer-run inflation goal using the PCE price index.
What is core inflation?
Core inflation commonly refers to a price index excluding food and energy. Economists use core measures to study underlying price pressure because food and energy can experience unusually large short-term price movements.
What is disinflation?
Disinflation means the inflation rate is declining while the general price level continues to rise. For example, a decline in annual inflation from 6% to 3% is disinflation, not deflation.
What is deflation?
Deflation is a sustained decline in the general price level. It differs from disinflation, where prices continue increasing but at a slower rate.
Why can my personal inflation feel higher than the official rate?
Official inflation indexes represent average spending patterns. A household spending an unusually large share of income on categories experiencing rapid price increases can face a higher personal inflation rate than the published average.
Why does the Federal Reserve target 2% inflation?
The Federal Reserve judges 2% PCE inflation over the longer run to be most consistent with its mandate for price stability and maximum employment. A low positive rate also provides greater distance from economically damaging deflation.
Does lower inflation mean prices will return to previous levels?
No. When inflation falls but remains positive, prices continue rising from their already higher level. Returning the overall price level to an earlier level would require a period of broad deflation.
Final Thoughts
Inflation is fundamentally about changes in the overall price level rather than the movement of one highly visible product.
Official indexes combine thousands of prices using spending weights so that major household expenses influence the calculation more than minor purchases. CPI and PCE use different methodologies, which is why the two measures can sometimes produce different readings without either being inherently wrong.
The distinction between inflation and the price level is equally important. A decline in inflation from 8% to 3% means prices are rising more slowly; it does not erase the earlier increase. That process is disinflation, while a sustained decline in the overall price level is deflation.
Inflation also has no single universal cause. Strong demand, supply disruptions, labor costs, commodity prices and expectations can interact differently across economic cycles.
For households, the practical issue is purchasing power. For businesses, inflation affects costs, pricing and investment decisions. For policymakers, the challenge is reducing excessive price pressure without unnecessarily damaging employment and economic activity.
Reading inflation well therefore requires more than one headline percentage. The measure being used, the time horizon, category contributions, underlying trend and broader economic environment all matter.