
What Is a Stock Market Crash?
Learn what causes a stock market crash, how severe declines develop, how they affect investors, and what historical crashes can teach us.
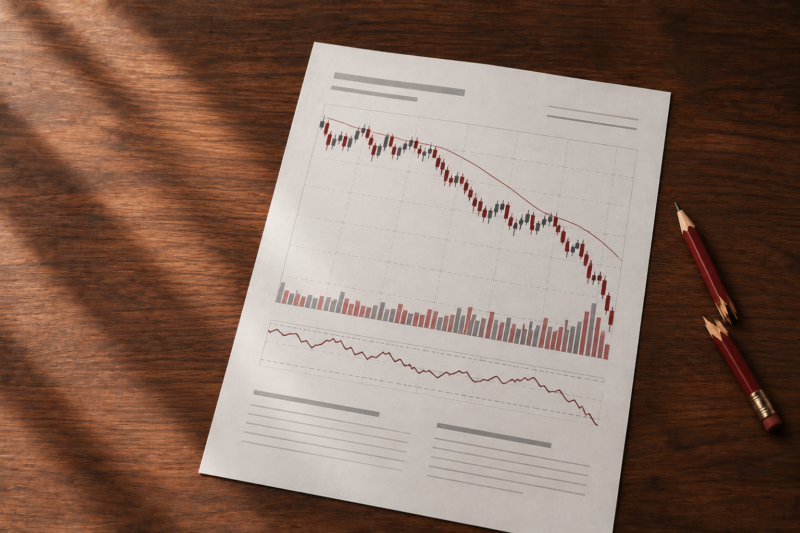
A stock market crash is a rapid and unusually large decline in stock prices across a broad part of the market. Crashes are typically driven by a sudden change in expectations, heavy selling, declining liquidity or financial stress. Unlike an ordinary market decline, a crash develops quickly enough to disrupt normal investor behavior and sometimes market functioning.
There is no single percentage decline that officially defines every stock market crash. The term is generally used when prices fall sharply over a short period and the move is severe enough to create widespread financial concern.
Understanding why crashes happen requires more than looking at a falling chart. A market decline can begin with economic news, excessive valuations, leverage or a financial shock, but trading mechanics and investor behavior can accelerate the movement once selling becomes intense.
What Is a Stock Market Crash?
A stock market crash is a sudden decline affecting a broad group of publicly traded securities or a major market index.
Three characteristics usually distinguish a crash from normal market volatility:
- the decline is unusually large;
- the decline occurs over a relatively short period;
- selling pressure and uncertainty increase rapidly.
A crash can happen in a single trading session, across several days or as part of a larger market decline.
For example, the Dow Jones Industrial Average fell 22.6% on October 19, 1987. Other major market crises developed over weeks or months rather than one dramatic day.
The word “crash” therefore describes the speed and severity of the market breakdown more than a fixed numerical threshold.
Investors who are still learning the basic market structure may find it helpful to first understand how the stock market works, because a crash affects the same exchanges, brokers, orders and liquidity mechanisms that operate during normal trading.
Stock Market Crash vs Correction vs Bear Market
These terms describe different types of market declines and should not be treated as interchangeable.
| Term | Typical Meaning | Main Characteristic |
|---|---|---|
| Market pullback | A relatively modest decline | Often short-lived and common |
| Correction | Often used for a decline of around 10% | Larger than routine volatility |
| Bear market | Commonly associated with a decline of about 20% or more | Can develop gradually over months |
| Stock market crash | No universal percentage definition | Sudden, severe and disorderly decline |
A market can enter bear-market territory without experiencing a dramatic one-day crash.
Likewise, a sudden crash can occur before it is clear whether prices will remain depressed long enough to create a prolonged bear market.
The distinction matters because the cause, speed and practical consequences of each type of decline can be different.
What Causes a Stock Market Crash?
Most crashes do not have one isolated cause.
A vulnerable market often develops first. A triggering event then changes investor expectations, and market mechanics can magnify the reaction.
Several factors commonly appear in major market breakdowns.
Excessive Valuations
Stock prices reflect expectations about future corporate earnings and growth.
When valuations rise far faster than underlying business fundamentals, the market becomes more dependent on continued optimism.
A disappointing earnings report, economic slowdown or change in interest-rate expectations can then cause investors to reconsider how much they are willing to pay.
High valuation alone does not guarantee a crash. However, expensive markets can become more sensitive to negative surprises because a larger amount of future success may already be reflected in prices.
Unexpected Economic Shocks
Markets can reprice rapidly when investors receive information that materially changes the economic outlook.
Possible shocks include:
- financial crises;
- bank failures;
- geopolitical events;
- pandemics;
- unexpected inflation;
- sudden interest-rate changes;
- severe disruptions to trade or production.
The market does not need to wait for corporate profits to decline before responding.
Prices can fall immediately when investors expect future earnings, credit conditions or economic growth to deteriorate.
Leverage
Leverage can amplify both gains and losses.
When investors use borrowed money to hold assets, falling prices can force them to provide additional collateral or reduce positions.
That creates a potential feedback loop:
- asset prices decline;
- leveraged positions lose value;
- investors face margin pressure;
- positions are sold to reduce risk;
- additional selling pushes prices lower.
The initial decline may therefore generate new selling that did not exist before prices started falling.
Loss of Liquidity
Liquidity becomes especially important during stressful markets.
Under normal conditions, a heavily traded stock may have many buyers close to the current market price.
During a severe decline, those buyers can withdraw orders or demand significantly lower prices before accepting additional risk.
The visible price can then fall rapidly from one available buying level to another.
This explains why a crash is not simply a situation in which “there are more sellers than buyers.” Every completed trade has both sides.
The deeper problem is that buyers may only be willing to participate at progressively lower prices.
Investor Psychology
Markets are driven by expectations, and expectations can change quickly.
Fear can cause investors to focus on avoiding losses rather than estimating long-term business value.
As prices fall, previously confident investors may interpret the decline itself as evidence that conditions are worse than expected.
This process can create herd behavior.
Investors who planned to hold assets for years may suddenly sell because other investors are selling, increasing pressure on prices without any new company-specific information.
Forced or Automated Selling
Not every sell order reflects a discretionary decision made at that moment.
Portfolio rules, risk limits, margin requirements and systematic strategies can cause positions to be reduced automatically when prices or volatility reach certain levels.
Those mechanisms can help explain why a market decline sometimes accelerates rather than progressing smoothly.
How Does a Stock Market Crash Develop?
A crash rarely follows exactly the same sequence, but a simplified example shows how market stress can reinforce itself.
Imagine a market index is already trading at historically demanding valuations.
A sudden economic event causes analysts to reduce their expectations for company profits.
Long-term investors begin selling some positions. Short-term traders also react to falling prices, while leveraged investors face increasing losses.
Available buyers lower their bids because uncertainty has increased.
As the gap between willing buyers and urgent sellers grows, prices move downward quickly.
Additional investors see the decline and decide to reduce risk. Stop orders or margin-related selling can add more supply.
Eventually the market may reach prices where new buyers are prepared to accept the uncertainty, or outside conditions may improve enough for selling pressure to stabilize.
This process shows why crashes can become nonlinear. A 5% decline does not necessarily create only twice the stress of a 2.5% decline. The larger move can activate entirely new sources of selling.
What Happens to Orders During a Market Crash?
Extreme volatility can make order execution behave differently from what investors experience during quiet trading.
Bid-Ask Spreads Can Widen
Market makers and other liquidity providers face greater uncertainty when prices move rapidly.
They may therefore quote wider spreads to compensate for the increased risk of trading.
Displayed Prices Can Change Quickly
The number shown on a brokerage platform can become outdated almost immediately in a fast market.
A market order prioritizes execution rather than a specific price, so the final transaction price can differ from what the investor saw before submitting the order.
Large Orders Can Move Through Several Price Levels
Suppose a stock currently shows an ask of $50, but only 100 shares are available at that price.
An investor attempting to buy 5,000 shares immediately may need to interact with sellers offering shares at $50.10, $50.30 or higher.
The same concept works in reverse during intense selling.
A large sell order may consume available bids and execute progressively lower.
Volatility Safeguards Can Pause Trading
Modern U.S. markets use market-wide circuit breakers during exceptionally severe declines.
The thresholds are based on the S&P 500’s decline from the previous day’s close:
| Level | S&P 500 Decline | Trading Response |
|---|---|---|
| Level 1 | 7% | 15-minute halt if triggered before the late-session cutoff |
| Level 2 | 13% | 15-minute halt if triggered before the late-session cutoff |
| Level 3 | 20% | Trading halted for the rest of the day |
The purpose of a trading halt is not to guarantee that prices will recover.
Instead, a pause gives market participants time to process information and allows trading interest to reorganize during extreme volatility.
Major Stock Market Crash Examples
Historical crashes demonstrate that similar price declines can emerge from very different economic and market conditions.
| Period | What Happened | Why It Matters |
|---|---|---|
| 1929 | Dow fell nearly 13% on Black Monday and almost 12% the following day | The crash became associated with a much longer economic and market collapse |
| 1987 | Dow fell 22.6% in one trading session | Showed how market structure and liquidity problems can intensify a rapid decline |
| 2007–2009 | S&P 500 ultimately fell about 57% from its 2007 peak to its 2009 trough | The decline was connected to a broader banking and credit crisis |
| 2020 | S&P 500 fell roughly 34% from February 19 to March 23 | An abrupt economic shock produced one of the fastest major declines in modern history |
The 1929 Stock Market Crash
The 1929 crash is one of the most famous examples because the market decline became associated with the Great Depression.
The Dow Jones Industrial Average fell nearly 13% on October 28, 1929, and almost another 12% the following day.
By mid-November, the index had lost almost half its value from the September peak.
The longer decline proved even more severe. The Dow eventually reached a level approximately 89% below its 1929 peak in 1932.
This episode demonstrates why the initial crash and the long-term economic consequences should be considered separately.
Black Monday in 1987
October 19, 1987 remains an extraordinary example of the speed at which markets can fall.
The Dow dropped 22.6% in a single day.
The decline also created operational and liquidity problems across stock, options and futures markets.
Unlike the early 1930s, however, the 1987 crash did not develop into an economic depression of comparable scale.
That contrast is important: the size of a one-day market decline does not automatically determine the severity of the subsequent economy.
The 2007–2009 Financial Crisis
The global financial crisis was not simply one dramatic trading day.
Problems in housing, mortgages, banking and credit markets developed into a broader financial breakdown.
The S&P 500 ultimately declined about 57% from its October 2007 peak to its March 2009 trough.
This period is a good example of how a stock-market collapse can accompany a deep recession, but the two terms do not describe the same event.
The 2020 Pandemic Decline
Early 2020 showed how rapidly markets can reprice when a completely new economic risk emerges.
The S&P 500 closed at 3,386.15 on February 19 and fell to 2,237.40 by March 23, a decline of roughly 34% in just over a month.
Market-wide circuit breakers were activated multiple times during March as volatility surged.
The subsequent recovery was unusually fast compared with many earlier bear markets, reinforcing another important lesson: a severe decline does not reveal in advance how long the recovery will take.
Does a Stock Market Crash Cause a Recession?
Not necessarily.
The stock market and the economy are related, but they measure different things.
Stock prices reflect investors’ expectations about future corporate profits, interest rates and risk.
A recession describes a broader decline in economic activity.
A crash can contribute to weaker economic conditions by reducing household wealth, damaging confidence or making financing more difficult.
At the same time, markets can fall sharply because investors anticipate a recession before official economic data confirms one.
There are also cases where markets decline dramatically without producing an economic downturn of similar severity.
For that reason, a market crash should be treated as a financial-market event rather than an automatic recession signal.
How Does a Stock Market Crash Affect Investors?
The impact depends heavily on portfolio structure, time horizon, leverage and the investor’s need for liquidity.
Portfolio Values Fall
The most obvious effect is a reduction in the market value of stock holdings.
A diversified equity portfolio can still decline significantly when most sectors fall together.
Volatility Increases
Daily price movements can become much larger than usual.
A stock might fall sharply one day and rebound strongly the next without returning to its previous price.
Correlations Can Rise
Assets that normally behave differently can move in the same direction during periods of intense stress.
This can make a portfolio appear less diversified precisely when diversification is most needed.
Leveraged Investors Face Greater Pressure
Borrowed money magnifies losses as well as gains.
An unleveraged investor can decide whether to continue holding a declining position. A leveraged investor may have less flexibility because margin requirements can force action.
Investor Behavior Can Become a Major Risk
A portfolio decline is only one part of the problem.
An investor may convert a temporary market loss into a permanent one by abandoning a previously suitable long-term strategy during a panic.
This does not mean investors should never sell. It means the reason for selling matters.
Can Technical Analysis Predict a Crash?
No analytical method can reliably identify every future crash in advance.
Chart-based tools can reveal weakening momentum, changing trends, unusually high volatility or important price levels.
Those observations may help traders manage risk, but they do not establish that a market crash must follow.
A market can remain expensive or technically weak for a long time before a major decline occurs. Conversely, unexpected events can trigger a rapid selloff even when previous price action appeared stable.
Our guide to technical analysis explains the role and limitations of chart-based market analysis in more detail.
Can Investors Know When a Crash Will End?
Market bottoms are usually obvious only in hindsight.
During a severe decline, economic news may still be deteriorating when stock prices begin to recover.
This happens because markets price expectations rather than waiting for conditions to become visibly good again.
A recovery can begin when investors decide that prices already reflect enough bad news, even if the economy remains weak.
Trying to wait for complete certainty can therefore create a different problem: by the time the outlook feels comfortable, prices may already have risen substantially.
Common Mistakes During a Stock Market Crash
Assuming Every Falling Stock Is a Bargain
A lower price is not proof of undervaluation.
Some companies emerge from crises stronger, while others suffer permanent damage.
The reason for the decline matters more than the percentage decline alone.
Changing Strategy Because of Panic
An investment strategy created for a multi-year objective should not automatically become a short-term trading strategy because prices are falling.
Decisions made under emotional pressure often lack the same reasoning that guided the original portfolio.
Using Leverage to Buy Every Decline
A falling market can continue falling far longer than expected.
Using borrowed money removes flexibility and can force liquidation before a recovery occurs.
Assuming Circuit Breakers Prevent Losses
Trading halts are market-structure safeguards, not price guarantees.
When trading resumes, prices can continue declining if selling pressure remains strong.
Believing Historical Recoveries Guarantee a Specific Future Timeline
Past markets have recovered from major declines, but the time required has varied enormously.
1929, 1987, 2008 and 2020 followed very different recovery paths.
A historical average cannot tell an individual investor exactly when a future market will recover.
A Practical Crash Scenario
Consider a diversified stock index currently trading at 5,000.
An unexpected financial shock changes expectations for corporate profits.
The index falls 4% during the morning.
As uncertainty grows, several large investors reduce positions and liquidity providers lower their bids.
The market decline reaches 7%.
A circuit breaker temporarily pauses trading.
During the halt, market participants review new information and submit revised orders.
When trading resumes, suppose buyers are still unwilling to pay previous prices. The index could continue falling despite the pause.
Alternatively, enough new demand may enter the market to stabilize prices.
The example illustrates three separate concepts:
- the initial shock changes expectations;
- liquidity and forced selling can amplify the decline;
- market safeguards can slow trading without determining the eventual price.
What Should Long-Term Investors Focus On?
A market crash can make daily price movements feel more important than long-term financial decisions.
For investors with long horizons, several questions are usually more useful than trying to predict the exact bottom:
- Has the original investment objective changed?
- Is the portfolio appropriately diversified?
- Is excessive leverage creating forced-sale risk?
- Will invested money be needed in the near future?
- Have the fundamentals of individual holdings materially deteriorated?
- Is portfolio risk still consistent with the investor’s real tolerance for losses?
A severe market decline often reveals whether a portfolio was realistically designed for the investor who owns it.
Risk tolerance measured during a rising market can be very different from risk tolerance experienced during an actual 30% decline.
Frequently Asked Questions
What is a stock market crash in simple terms?
A stock market crash is a sudden and unusually severe decline in stock prices across a large part of the market. Crashes typically involve intense selling, rapidly changing expectations, reduced liquidity and much larger price movements than investors experience during ordinary market conditions.
How much does the stock market have to fall to be called a crash?
There is no universally accepted percentage decline that formally defines a stock market crash. The term generally describes a rapid and severe fall. By contrast, a correction is commonly associated with a decline of around 10%, while a bear market is often associated with a decline of roughly 20% or more.
What causes stock market crashes?
Crashes can result from combinations of economic shocks, excessive valuations, financial stress, leverage, weakening liquidity, investor panic and forced selling. The initial trigger and the mechanism that accelerates the decline are not always the same.
Can a stock market crash happen without a recession?
Yes. A stock market crash and a recession are different events. Stock prices can fall sharply without a comparably severe economic contraction, and recessions can also occur without a sudden market crash.
Do circuit breakers stop a stock market crash?
No. Circuit breakers temporarily pause trading during severe market declines. They give participants time to process information and reorganize orders, but they do not guarantee higher prices when trading resumes.
How long does a stock market crash last?
There is no standard duration. The most dramatic phase may last hours or days, while the broader bear market can continue for months or years. Historical recovery times have varied substantially depending on the cause and economic environment.
Can technical analysis predict the next crash?
Technical analysis can identify changes in trend, volatility and market behavior, but it cannot consistently predict every crash. Unexpected economic or financial events can cause markets to change direction faster than historical chart patterns can anticipate.
Is every stock market crash a buying opportunity?
No. Lower prices can create opportunities, but individual companies may also face permanent financial or competitive damage. Investment decisions should consider valuation, business fundamentals, diversification, time horizon and risk rather than relying only on the size of the decline.
Final Thoughts
A stock market crash is not simply a large red number on an index chart.
Severe declines combine changing economic expectations with market mechanics, liquidity conditions and investor behavior.
The historical record also shows that crashes are not identical. The 1929 collapse became part of a prolonged economic crisis. The 1987 crash produced an extraordinary one-day loss without a comparable depression. The financial crisis of 2007–2009 unfolded over a much longer period, while the 2020 decline occurred and reversed with exceptional speed.
The most useful lesson is therefore not to search for one perfect crash indicator.
Investors benefit more from understanding how leverage, liquidity, valuation, order execution and portfolio risk interact when conditions become stressful.
A well-designed strategy cannot eliminate market crashes, but it can reduce the chance that temporary market chaos forces an investor into decisions that conflict with long-term objectives.